


Frequency Explorer
Interactive Frequency Chart for musicians & sound engineers
The Interactive Frequency Chart is a practical tool for musicians, audio engineers, producers, worship teams, and students who want to better understand where instruments and sounds sit across the audio spectrum.
Use the chart to explore instrument frequency ranges, identify important EQ bands, and see how low, mid, and high frequencies relate to one another. Whether you are mixing a recording, running live sound, shaping a worship mix, or learning how equalization works, the Frequency Explorer gives you a visual reference for making better audio decisions.
Different instruments often share overlapping frequencies, which can make a mix sound muddy, harsh, thin, or unclear. Knowing where those frequencies live helps you decide what to boost, cut, or leave alone. The chart is designed as a starting point for critical listening, not a replacement for your ears.
Use the Frequency Explorer to study the frequency ranges of vocals, guitars, bass, drums, keyboards, and other instruments, and learn how the broader audio frequency spectrum affects clarity, warmth, presence, and definition.
Explore the chart, compare frequency ranges, and use what you discover to make more intentional EQ and mixing choices.
Frequency Chart Note
When instruments produce notes, overtones carry on above the notes.
The extensions in the frequency chart show how far harmonics and noise can extend; both can also fall within the note range displayed by the green bar.


How to read the Interactive Frequency chart & where the ranges come from
Start with the green bars. They show the fundamental frequencies of the notes—the pitches you hear. Why does that matter? Because the note is only part of the sound. Its overtones, attack, and breath help you recognize the instrument or voice. The green bar does not show all of that, or tell you which frequencies are loudest.
The purple and blue extensions show approximate upper limits for harmonics and noise from the DPA reference. We draw them after the green bar so you can see both. Harmonics and noise also overlap the notes themselves. The note ranges and upper limits come from different reference conditions; they aren't measurements from one performance. Your instrument, playing level, and microphone will affect what you hear.
What about the words below the chart? They help you connect a frequency with an experience you can recognize. Warmth can become mud. Presence can become harshness. The ranges are approximate teaching choices informed by the linked references, so more than one description may fit what you hear.
A few things to keep in mind: some of the highest notes need advanced technique. The voice categories give you a reference, not a test for your singer. And the drum and cymbal bands point to places to listen; they do not show every frequency those instruments produce.
🎤 Yale Library · reference vocal ranges
🎚️ iZotope · EQ listening guide
🎤 Shure · church sound and frequency descriptions
🎧 PreSonus · EQ frequency guide
🎸 Yamaha · guitar tuning and range
🎹 American Guild of Organists · organ pitch
🎤 UNSW · notes and frequencies https://www.phys.unsw.edu.au/jw/notes.html
Each orchestral row links to its specific VSL Academy range reference.
The chart uses A4 = 440 Hz and equal temperament. You are seeing the notes that actually sound, even when an instrument’s written part uses different pitches. Your custom range stays here until you reload or close the page.
Why listening volume changes what you hear
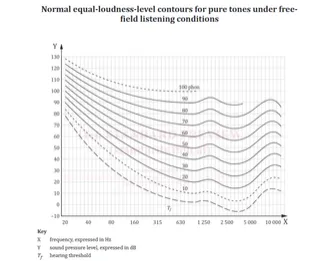
Chart source: Custom Audio Designs — Equal Loudness Contours, labeled ISO 226:2023. Select the chart to view it full size. The image loads from their website and requires an internet connection.
Turn the same mix down. Does the bass seem to step back? Our ears respond differently across the frequency range, and that balance changes with listening level. Before reaching for the EQ, ask yourself: did the mix change, or did I change the volume?
Equal-loudness curves help explain this. Follow one curve, and you are following tones judged equally loud, even though their sound pressure levels differ. A higher point means that frequency needs more sound pressure to match the same perceived loudness.
You will see the word phon on these charts. It names a loudness level by comparison with a 1 kHz tone. For example, a tone on the 40-phon curve sounds as loud as that reference tone at 40 dB SPL. That doesn't mean every frequency on that curve measures 40 dB SPL.
For mixing, keep this question in mind: am I comparing sounds at a consistent listening level? Use the curves to understand your ears. They are not an EQ shape to apply to the band, and the highest curve is not a pain threshold or a safe listening limit.
The current reference is ISO 226:2023. It describes pure tones heard with both ears, from directly ahead in a free sound field, by listeners aged 18–25 with normal hearing. Its tabulated frequencies run from 20 Hz to 12.5 kHz. That is a particular listening test, not a measurement of your hearing or the sound of a whole worship team.
The reference chart above is a static image. The interactive instrument ranges and listening descriptions remain in the frequency explorer above.
Sources and credits
Historical inspiration: Interactive Frequency Chart, credited to ©2006 GJS / Independent Recording Network. View a third-party archive of the earlier chart. The archive is maintained independently of its original creator.
YWEH Music’s Frequency Explorer has a newly built interface and newly written explanations, with reference sources linked throughout. The earlier chart’s images, logo, and code are not included. The equal-loudness reference image is credited separately above. Source acknowledgment does not imply permission or endorsement.
Want to work with us?
Your Paragraph text goes Lorem ipsum dolor sit amet, consectetur adipisicing elit. Autem dolore, alias, numquam enim ab voluptate id quam harum ducimus cupiditate similique quisquam et deserunt, recusandae. here
© Copyright 2020 - 2026. YWEH music, LLC. All Rights Reserved.
Terms and Conditions | Privacy Policy | Powered by YWEH music™